Well-architected framework (WAF) on Azure
Designed for resilient, efficient cloud workloads

Hey everyone, let’s talk about something that most teams either ignore until it’s too late or overcomplicate from day one: observability. You know that feeling when production breaks at 2 AM and you’re staring at logs like a detective trying to solve a cold case with no evidence? Yeah, that’s what happens when your monitoring strategy is an afterthought. Today we’re going to walk through how to build a Monitoring Golden Path, a structured, repeatable approach to observability that any organization can adopt.
This article is based on an open-source project I built called Azure Observability Strategies, which contains production-ready Bicep modules, demo applications with distributed tracing, and step-by-step verification guides. Feel free to explore the repo and use it as a reference for your own implementations.
Think of it as the paved road for observability. Instead of every team reinventing the wheel deciding which tools to use, how to name resources, where to send logs, or what alerts to set up, you provide a well-defined path that covers the essentials out of the box. Teams get production-ready monitoring by following the path, and they can extend it when needed.
A solid Golden Path typically covers these pillars:
| Step | Topic | What It Solves |
|---|---|---|
| 1 | Monitoring Strategy | Where does telemetry go? Single workspace vs. scattered chaos |
| 2 | Naming & Tags | Can you find your resources at 2 AM? |
| 3 | Distributed Tracing | Following a request across 5 services without losing your mind |
| 4 | Sampling | Keeping 100% of data in dev, 10% in prod, and your CFO happy |
| 5 | Retention & Costs | How long to keep data before it becomes expensive nostalgia |
| 6 | Auto-Instrumentation | Getting telemetry with minimal code changes |
| 7 | Governance & Security | Who sees what, and making sure PII stays out of logs |
| 8 | Operational Layer | Alerts, dashboards, and the “something is broken” notifications |
The first decision is architectural: where does all your telemetry go?
The recommended approach is a single Log Analytics Workspace feeding all your Application Insights instances. This gives you unified querying across all services, no more jumping between five different dashboards to understand one incident. You can see this architecture implemented in the main.bicep orchestration file of the repository.
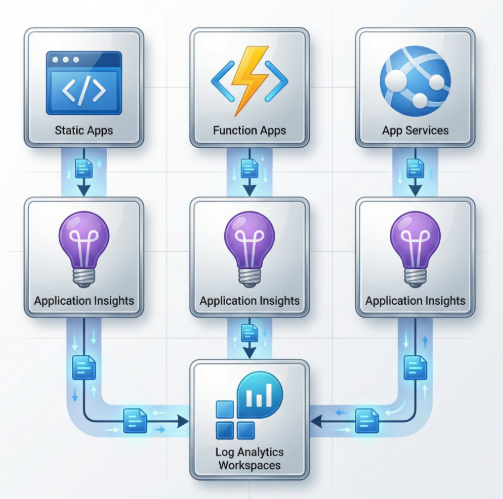
Each component gets its own Application Insights instance (for isolation and independent sampling), but they all flow into the same workspace. This is the difference between “I can see everything” and “I can see my one service, good luck with the rest.”
The classic (standalone) Application Insights is deprecated. Workspace-based mode is the modern approach and gives you:
This might sound boring, but trust me, naming saves lives at 2 AM.
Adopt a consistent pattern like: {type}-{workload}-{env}-{region}
| Resource Type | Naming Example |
|---|---|
| Resource Group | rg-myapp-prod-weu |
| Log Analytics Workspace | law-myapp-prod-weu |
| Application Insights | appi-web-myapp-prod-weu |
| Alert Rules | alrt-prod-myapp-web-5xx |
And enforce required tags through policy. At minimum:
dev, staging, prodThe key here is enforcement, not just guidelines. Use policies in Audit mode for dev (warn but don’t block) and Deny mode for production (no tag, no deployment).
This is where it gets really interesting. In a microservices world, a single user request can touch 5, 10, or 20 services. Without distributed tracing, debugging is like trying to follow a conversation in a crowded room while wearing earplugs.
OpenTelemetry (OTel) is the industry-standard framework for distributed tracing, and it’s the recommended approach for cloud-native observability. The key concepts:
traceparent) that propagates trace IDs across servicesImagine a user hits your web app, which calls your API, which triggers a serverless function:
1. 🌐 Web receives GET /demo           (AppRequests)
2. 📡 Web calls API /orders/{id}       (AppDependencies)
3. 🔧 API receives /orders/{id}        (AppRequests)
4. ⚡ API calls Function /api/enrich    (AppDependencies)
5. 🔌 Function receives /api/enrich    (AppRequests)
All five operations share the same TraceId. You can query them all at once and see the exact flow, latency at each hop, and where things broke. The demo applications in the repository implement exactly this pattern with a .NET 9 Web + API + Azure Functions stack.
The beauty of modern OTel distros is how little code you need. For a .NET application, it’s essentially one package and three lines of code:
// Package: Azure.Monitor.OpenTelemetry.AspNetCore

builder.Services.AddOpenTelemetry()
    .ConfigureResource(resource => resource
        .AddService(serviceName: "web-myapp", serviceVersion: "1.0.0"))
    .UseAzureMonitor(options =>
    {
        options.SamplingRatio = 1.0f; // 100% in dev, 0.1 (10%) in prod
    });
That’s it. This automatically instruments:
| What | Instrumented? |
|---|---|
| Incoming HTTP requests | ✅ |
| Outgoing HTTP calls (HttpClient) | ✅ |
| SQL database queries | ✅ |
| Azure SDK calls (Storage, Service Bus) | ✅ |
| W3C TraceContext propagation | ✅ |
No manual span creation, no decorators, no middleware. The distro handles it. Check the full OpenTelemetry standard documentation for detailed configuration examples across Web, API, and Azure Functions.
Here’s a question most teams don’t ask until the bill arrives: Do you really need 100% of your telemetry in production?
If your API handles 10 million requests per day, capturing every single one means massive storage costs and slow queries. The answer is sampling: keep a statistically significant percentage and let the math do the rest.
| Environment | Sampling Ratio | What It Means |
|---|---|---|
| Development | 1.0 (100%) |
Full visibility for debugging |
| Production | 0.1 (10%) |
Cost control; statistically significant for alerting and trends |
The sampling decision is made at the trace level, not the span level. This means if a trace is sampled in, all spans in that trace are kept. No broken traces, no missing pieces in your dependency chain.
And here’s the thing: metrics are never sampled. Your alert rules based on error counts, response times, and failure rates always use 100% of the data, regardless of the sampling ratio. Sampling only affects detailed transaction logs.
If production catches fire and you need to temporarily see more, you can override sampling at runtime:
# Temporarily increase to 50% during an incident investigation
az webapp config appsettings set \
  --name mywebapp \
  --resource-group myrg \
  --settings OTEL_SAMPLING_RATIO=0.5
No redeployment needed.
Observability at scale requires intentional choices about what to keep and how long to keep it. Uncontrolled telemetry leads to exploding costs, important signals buried in noise, and slow queries over massive datasets.
| Environment | Retention | Rationale |
|---|---|---|
| Development | 14 days | Short debugging cycles; data rarely needed beyond 2 weeks |
| Production | 30 days | Incident investigation, compliance, trend analysis |
This is something people don’t think about until it’s too late:
| Log Type | Typical Size | Impact at 1M Requests/day |
|---|---|---|
| Structured log (1 line) | ~500 bytes | ~15 GB/month |
| Request body (JSON) | ~5 KB | ~150 GB/month |
A single logger.LogInformation("Request body: {Body}", jsonBody) in a hot path can cost more than the compute running your app. Be intentional about what you log.
Not all telemetry is created equal. You might want to keep AppExceptions for 90 days but AppTraces (verbose logs) for only 14 days. Modern Log Analytics supports per-table retention policies, letting you fine-tune costs without losing critical data. For a deeper dive into sampling ratios, log level strategies, and cost estimation formulas, check the Sampling, Retention & Cost Controls Standard.
The governance pillar covers four key areas:
1. Access Control (RBAC): Who can view telemetry? Who can modify alerts? Follow least-privilege and scope roles to the monitoring resource group.
2. Data Minimization (PII Prevention): This is a big one. Your telemetry should never contain PII. No email addresses, no user IDs, no IP addresses in log messages. Establish a default DENY policy for PII in telemetry and use safe structured logging patterns:
// ❌ BAD - PII in logs
logger.LogInformation("User {Email} placed order {OrderId}", user.Email, orderId);

// ✅ GOOD - No PII
logger.LogInformation("Order {OrderId} placed by user {UserId}", orderId, user.HashedId);
3. Data Residency: Know where your telemetry lives. If you operate in the EU, your Log Analytics Workspace should be in an EU region. No cross-border data transfer surprises.
4. Retention & Deletion: Right to erasure (GDPR Article 17) applies to telemetry too. Plan for it.
This is where raw telemetry transforms into actionable intelligence. Collecting data is meaningless if nobody sees it when things break.
Every production workload should ship with a minimum set of alerts. Here’s a solid starting point:
| Alert | Signal | Dev Threshold | Prod Threshold |
|---|---|---|---|
| HTTP 5xx Errors | Server errors | >10 in 15min | >5 in 15min |
| High Latency | Avg response time | >5000ms | >2000ms |
| Exception Spike | Exception count | >20 in 15min | >5 in 15min |
| Function Failures | Failed executions | >10 in 15min | >3 in 15min |
Notice the dev thresholds are more relaxed. You don’t want to wake someone up because a dev environment had a hiccup, but you absolutely want to know when production crosses the line.
Alerts need to go somewhere. Configure Action Groups with:
Use the Common Alert Schema so all alerts produce a consistent JSON payload. This makes it trivial to build automation on top. The ops-alerting-workbooks module in the repository deploys all 8 baseline alerts, action groups, and an operational workbook in a single Bicep module.
Finally, build a workbook (or Grafana dashboard, whatever your team prefers) that shows at a glance:
Here’s the thing that ties everything together: all of this should be codified. Your monitoring infrastructure should live in the same repo as your application, deployed through the same pipeline, and reviewed through the same PR process.
Whether you use Bicep, Terraform, or Pulumi, your monitoring stack should be:
This isn’t just good practice, it’s the only way to scale observability across an organization. You can’t have a “monitoring team” manually clicking through portals for 50 workloads. The Azure Observability Strategies repository is a working example of this approach, with reusable Bicep modules for foundation, App Insights, compute, diagnostics, alerting, policies, and security.
If you take one thing away from this article, it’s that observability is not a single tool or service, it’s a strategy with multiple layers:
Each step builds on the previous one, and together they form a complete observability foundation that any team can adopt.
Observability is never “done.” Your architecture evolves, your traffic patterns change, and new services introduce new failure modes. Treat your monitoring strategy the same way you treat your application code: iterate, review, and improve continuously. The goal isn’t perfection on day one, it’s having a foundation solid enough that when production breaks at 2 AM, you actually have the data to fix it before your coffee gets cold.
Designed for resilient, efficient cloud workloads
Let's explore the essential topics from Azure OpenAI Service using Terraform.